This report provides the overview of how do issues affect your software. We recommend learning more about Issues Management to know how the issues and issue reports are processed in DevMate.
Crashes and Exceptions Ratio
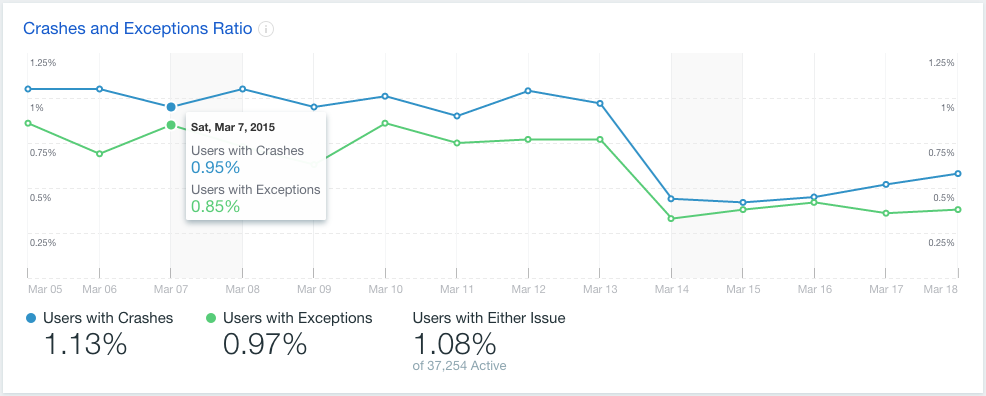
The graph is displaying the dynamics of the following metrics:
- Percent of customers with crashes
- Percent of customers with exceptions
Each point on the graph represents the value of a metric at a distinct day. To view the numeric value of metrics, hover your mouse over the graph, and a tool tip with values will be displayed.
You can hide/show the lines on the graph by clicking on widgets below the graph. The widgets are showing the total values of metrics for the time period selected.
Crash and Exception Reports

The graph displays the dynamics of the following metrics:
- Number of crash reports
- Number of exception reports
'Crash Reports' and 'Exceptions Reports' shows the numbers of the corresponding metrics and the number of unique crashes and exceptions are shown. The 'Total Submitted Reports' widget displays number of all issue reports, received by DevMate, the total number of unique issues, and the percentage of customers affected by issues.
Most Affected App Localizations
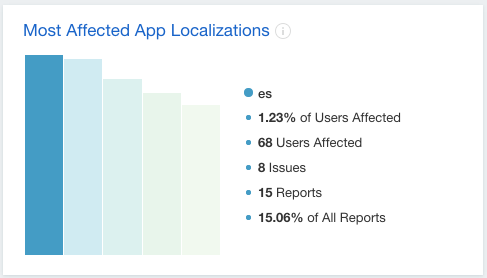
This bar chart displays the distribution of customers, who experienced issues by app localization.
The legend displays the numeric values of metrics. To view more info, hover on the bar, and legend will show you the percent of customers affected, the number of issues within selected locale, the total number of issue reports and percentage of reports received within this locale. To lock this view, click on a bar, the next click will unlock it.
Click on widget title will follow you to Issues Management page, where you will be able to view all crash reports.
Most Affected App Versions
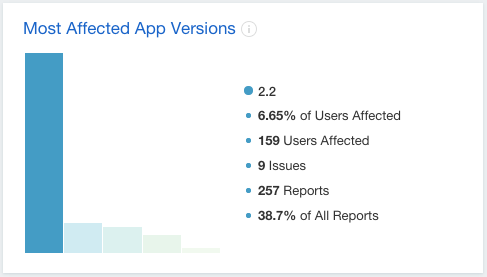
This bar chart displays the distribution of customers, which experienced at least one issue, by app versions.
The legend displays the numeric values of metrics. To view more info, hover on the bar, and legend will show you the percent of customers affected, the number of issues occurred on selected version, the total number of issue reports and percentage of reports received within this locale.
Click on widget title will follow you to Issues Management page, where you will be able to view all crash reports.
Most Affected OS Versions
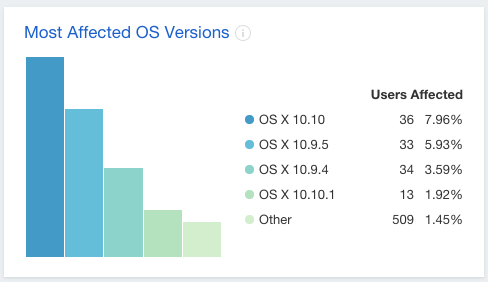
This bar chart displays the distribution of customers, who experienced at least one issue by OS versions.
The legend displays the numeric values of metrics. To view more info, hover on the bar, and legend will show you the percent of customers affected, the number of issues occurred on selected version, the total number of issue reports and percentage of reports received within this locale.
Click on widget title will follow you to Issues Management page, where you will be able to view all crash reports.
Most Affected Hardware
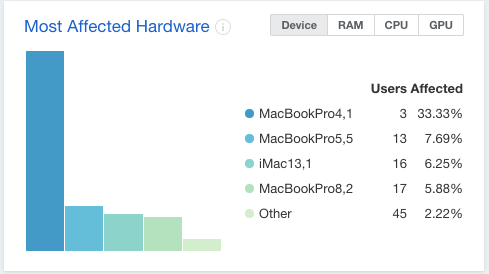
This bar chart displays the distribution of customers, who experienced issues by the following hardware components:
- Device
- RAM
- CPU
- GPU
You can switch between hardware components using the buttons at right top corner of the widget.
The legend displays the numeric values of metrics. To view more info, hover on the bar, and legend will show you the percent of customers affected, the number of issues occurred on this hardware, the total number of issue reports and percentage of reports received with this hardware component.
Click on widget title will follow you to Issues Management page, where you will be able to view all crash reports.
Issues by Frequency

This table displays the detailed stats on all issues that occurred in your app, including:
- Status
- Issue ID – DevMate issue ID
- Type
- Issue Name – either the default one or the one you've assigned in Issues Management
- Number of Reports – number of reports with the crash
- Percentage of all reports
- Percentage of customers affected
- Date of the first occurrence – the first time issue report was received by DevMate
- Date of the last occurrence – the last time issue report was received by DevMate
Buttons at the right top corner allow to filter issues by their status:
- New (default)
- In Progress
- Fixed
- Won't Fix
- Reopened
- All
By default, the table is sorted by percent of customers affected, but you can change the sorting by clicking on table column header.
To find the name of specific issue you can use the search bar at the top of the column with their name: type the name you'd like to find and hit Return.
